Analyzing Wednesday's trades:
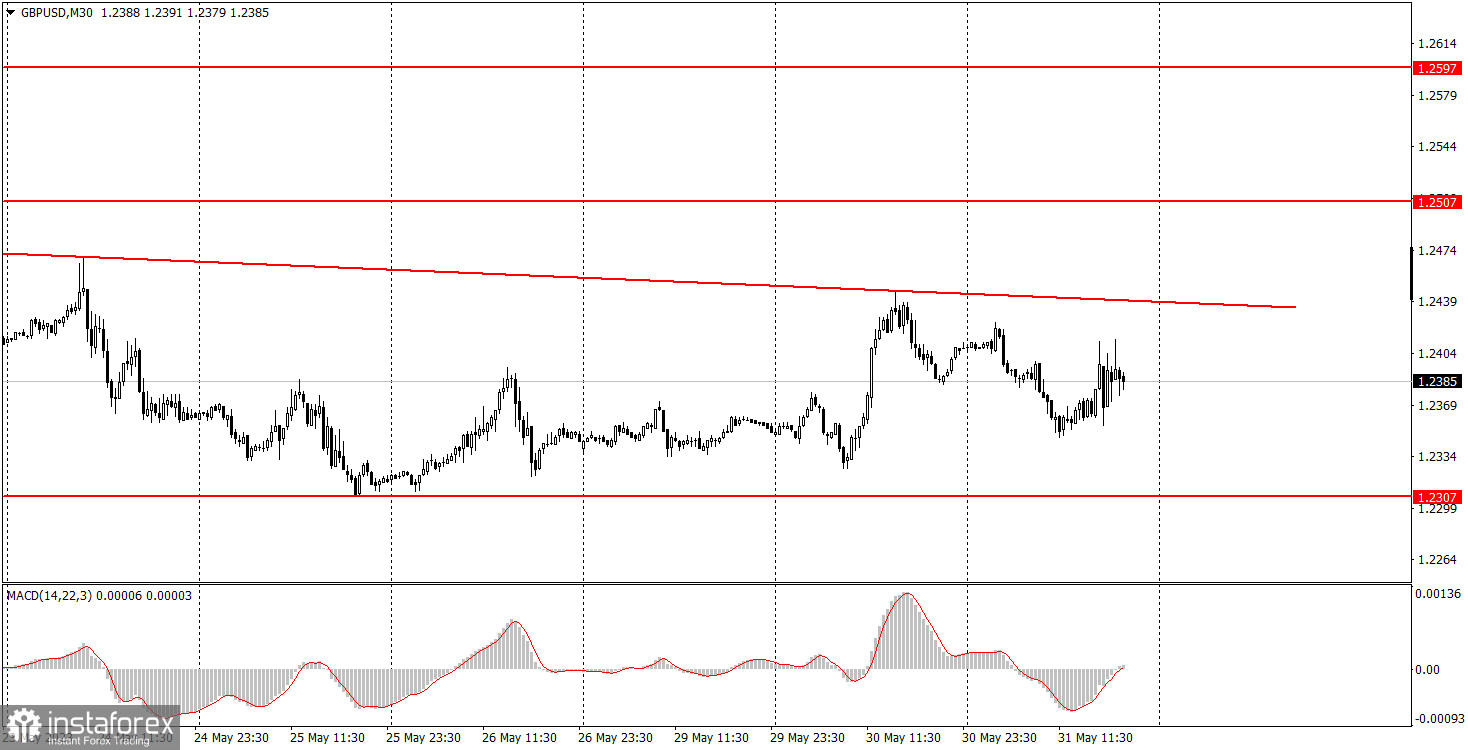
GBP/USD on 30M chart
The GBP/USD pair also traded in different directions on Wednesday, although there were fewer macroeconomic events for this pair. Let's start with the fact that Top Federal Reserve official Loretta Mester said that she sees no 'compelling' reason to pause rate hikes, which immediately triggered a new rise in the dollar. The new downward-sloping trend line is currently keeping the pair below it, thereby maintaining the downtrend. The UK did not release any important report on Wednesday, while the US only published the report on job vacancies for April, which turned out to be much stronger than expected. However, for some reason, the US dollar did not significantly appreciate against the pound. The pound continues to fall against the dollar much less eagerly than the euro. Nevertheless, the downtrend persists, and we still expect further decline.
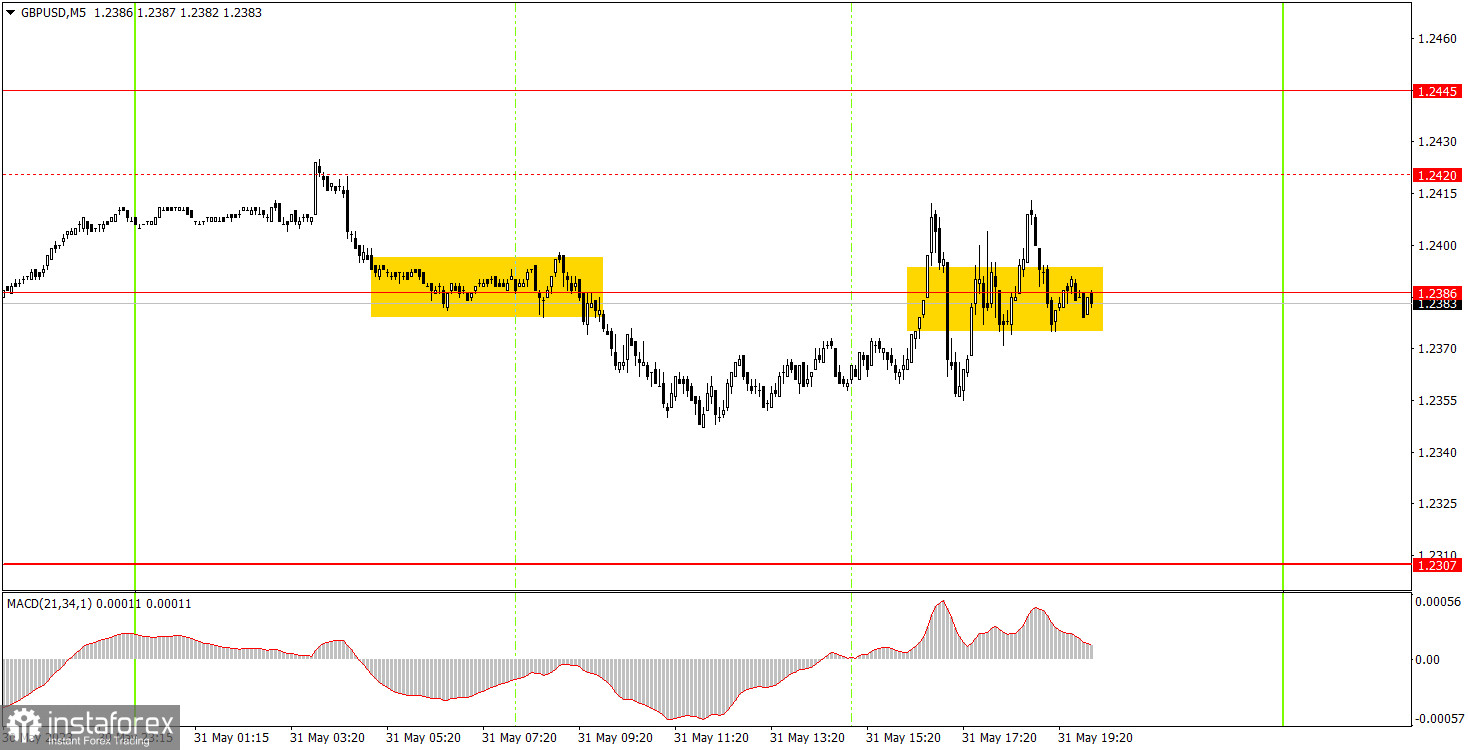
GBP/USD on 5M chart
Several trading signals were formed on the 5-minute chart, and they were not ideal for trading. The first signal formed in the morning, and after that, the price fell by about 30 pips, which was enough to set the Stop Loss at breakeven, nothing more. During the US trading session, there was constant back and forth movement, and it's very difficult to say what caused such volatility. Novice traders may have executed the very first buy signal, most likely resulting in a loss, and it was not advisable to trade other signals around the 1.2386 level. It is clear that it is impossible to predict such movements, and it would be inconvenient to trade in such conditions.
Trading tips on Thursday:
As seen on the 30M chart, the GBP/USD pair is generally moving down, but over the past week, we have seen more of a consolidation than a trend-driven movement. I expect the pound to fall further since it has not fallen enough yet. Breaking the new trendline may temporarily change market sentiment to bullish. The key levels on the 5M chart are 1.2171-1.2179, 1.2245, 1.2307, 1.2386, 1.2445, 1.2507-1.2520, 1.2597-1.2616. When the price moves 20 pips in the right direction after opening a trade, a stop loss can be set at breakeven. In the UK, there are no important events planned for Thursday, except for the final Manufacturing Purchasing Managers' Index for May. The US will release much more significant data, including jobless claims (secondary report), the ADP report, and the ISM Manufacturing Index. Therefore, volatility may be quite high on Thursday, but will the pound be able to show an intraday trend?
Basic rules of the trading system:
1) The strength of the signal depends on the time period during which the signal was formed (a rebound or a break). The shorter this period, the stronger the signal.
2) If two or more trades were opened at some level following false signals, i.e. those signals that did not lead the price to Take Profit level or the nearest target levels, then any consequent signals near this level should be ignored.
3) During the flat trend, any currency pair may form a lot of false signals or do not produce any signals at all. In any case, the flat trend is not the best condition for trading.
4) Trades are opened in the time period between the beginning of the European session and until the middle of the American one when all deals should be closed manually.
5) We can pay attention to the MACD signals in the 30M time frame only if there is good volatility and a definite trend confirmed by a trend line or a trend channel.
6) If two key levels are too close to each other (about 5-15 pips), then this is a support or resistance area.
How to read charts:
Support and Resistance price levels can serve as targets when buying or selling. You can place Take Profit levels near them.
Red lines are channels or trend lines that display the current trend and show which direction is better to trade.
MACD indicator (14,22,3) is a histogram and a signal line showing when it is better to enter the market when they cross. This indicator is better to be used in combination with trend channels or trend lines.
Important speeches and reports that are always reflected in the economic calendars can greatly influence the movement of a currency pair. Therefore, during such events, it is recommended to trade as carefully as possible or exit the market in order to avoid a sharp price reversal against the previous movement.
Beginners should remember that every trade cannot be profitable. The development of a reliable strategy and money management are the key to success in trading over a long period of time.